
The world of data analytics and visualization is in constant flux as new players keep entering the market, giving tough competition to existing players. The high demand for data analytics is attracting these new players. Companies are increasingly turning to business intelligence tools like Tableau vs. Power BI to achieve business goals and remain competitive. Tableau and Power BI fit the bill, but there are key differences between Tableau and Power BI in data visualization services.
But how do you know which tool to opt for? A good data analytics tool has brand recognition, offers ease of use, and is price-competitive. Tableau and Power BI fit the bill, but there are key differences between the two.
This article offers a comprehensive comparison of the two leading business intelligence tools. Let’s dive into key features, benefits, products, and differences of data visualization tools.
What is Tableau?
Tableau is a robust, fast-growing business intelligence tool known for rendering beautiful data visualizations. It enables you to report and analyze vast volumes of data, organizing it into actionable insights. Tableau creates data visualizations in the form of worksheets and dashboards. Thus, your employees can easily comprehend how data is generated with Tableau.
Tableau targets corporations with deep pockets and skilled data engineers. It has a free version available, but with limited features and capabilities. With Tableau, the more you pay, the more features and capabilities you get.
Tableau Features
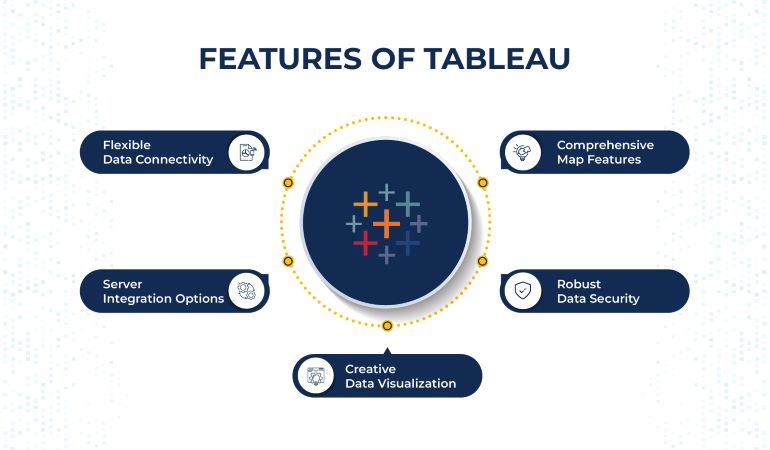
Some of Tableau’s features and benefits are:
- It is highly flexible and lets you connect different types of data using data connectors for various databases. So, you can connect to a JSON file, text file, Excel file, etc.
- Tableau lets you connect to various servers, such as Microsoft SQL Server and Tableau Server.
- It is an intuitive platform that lets you represent data in creative ways using Gantt charts, histograms, boxplots, motion charts, etc.
- Tableau offers a map feature that comes with pre-installed information like administrative boundaries, postal codes, cities, etc. This enables you to create very useful maps on Tableau.
- It facilitates setting up live data connections, thus enabling you to use data directly from its source(s).
- Tableau offers excellent data and user security by using permission systems and authentication features for data access and connections.
- It has an amazing feature called Ask Data. This feature enables you to type data-related queries in a common language, and it answers them with automatic data visualizations.
Tableau Products
This platform provides everything you need to access, analyze, and visualize your data. Tableau Desktop offers a powerful drag-and-drop feature that empowers you with crucial business insights. You can use these insights for faster and more effective decision-making.
Tableau Prep Builder: The Prep Builder helps you prepare data by enabling you to combine, shape, and clean it. It is an intuitive product that automates your data prep flows and allows you to analyze your data faster. Furthermore, the Tableau Prep Builder encourages collaboration and gives you a complete picture of your data.
Tableau Server: It serves as the main repository for data visualizations, data sources, and users. Tableau Services provides you with a secure environment where you can explore your data. Moreover, it is known for its easy deployment, integration, and scalability.
Tableau Cloud: Formerly called Tableau Online, Tableau Cloud is an enterprise-level, cloud-based analytics tool. It is an easy-to-use, fast, and flexible self-service platform that streamlines your company’s data for you. You can author, prepare, analyze, and publish your data using Tableau Cloud.
Tableau Embedded Analytics: It arms you with integrated visual analytics to drive customer and product engagement. Plus, it saves you time, money, and resources, allowing you to focus on building your product(s).
Tableau Mobile: Tableau Mobile enables you to make data-driven decisions wherever you are using your Android or iOS device. Thus, it becomes very convenient for users to access and monitor data.
Tableau Advantages
Advanced Visualizations and Analytics: Offers higher flexibility and advanced options for the visualization and analytics of data.
Better handling of large datasets: It tends to be better than Power BI with very large datasets.
Multi-platform availability: It’s available on several platforms, including Windows and Mac OS.
Strong community and support: This has a big, active community and extensive support resources.
Tableau Disadvantages
Cost: It is more expensive than Power BI and can be out of budget for individual or small business use.
Steeper learning curve: It may be more difficult for new or non-technical users to learn.
Not as smooth integration with Microsoft products: Although it connects to different data sources, it does not integrate as seamlessly with Microsoft products as Power BI does.
What is Power BI?
Microsoft Power BI is a leading business analytics tool that was developed by Microsoft. It is used for data analytics, qualitative data visualizations, and for making ad-hoc reports that give a comprehensive view of the dataset. Power BI allows you to manage your data from multiple sources after the cleaning and integration processes are completed.
Power BI is part of the Microsoft Power Platform. It employs dynamic compression algorithms to import data.PIXB files. Moreover, Power BI has over 100 connectors and a powerful drag-and-drop feature. The dashboards you create using Power BI are easy to understand and practical.
Another thing you should know about Power BI is that it is perfectly compatible with all the other Microsoft products and uses Azure, Excel, and SQL. Power BI is the perfect business intelligence tool for you if you already use Microsoft products.
Let’s explore some features of Power BI, top benefits, and products.
Power BI Features

Some of Power BI’s features are;
- It can figure out trends in real time, thus helping you identify issues and improve performance.
- Power BI has a simple interface, which makes it very easy to use.
- Its Q&A feature answers your questions and enables data exploration.
- Power BI has advanced data visualization features that let you visualize data in many different ways. It offers a wide range of data visualization options like bar charts, column charts, area charts, decomposition trees, funnel graphs, donut charts, etc.
- Power BI Get Data feature, which lets you choose data from various data sources like Power BI dataflows, Power BI datasets, SQL servers, and others.
- It offers flexible tiles that can be easily adjusted and managed. A tile in Power BI is a single block used in dashboard visualization.
- Power BI gives you DAX (Data Analytics Expressions) features, which are predefined codes used for performing data analysis.
Power BI Products
BI Desktop: This is a free platform that enables connection with multiple data sources. You can turn the collected data into a data model for sharing reports and visuals.
Power BI Service: It is a SaaS-based product of Power BI, also known as Power BI. You can use it to collaborate and distribute reports.
Power BI Mobile: This is Power BI’s mobile application. It lets you connect to your cloud and on-premises data, thus giving you access to up-to-date information at all times.
Power BI Report Server: This is an on-premises, enterprise-grade tool used for reporting that has the flexibility to move to the cloud. It provides users with access to interactive reports, enabling the quick discovery of trends and patterns. Moreover, you can use the Power BI Report Server to generate paginated reports.
Power BI Embedded: It embeds interactive reports, visuals, and dashboards into an application without requiring you to build and maintain the analytics.
Power BI Advantages
Cost-effective: Power BI is cheaper, especially for small to medium-sized businesses.
Integration with other Microsoft tools: It supports all Microsoft products like Excel, Azure, and SQL Server, which makes it a natural choice for an organization already using Microsoft products.
Ease of use: It is known for having a user-friendly interface, making it ideal for beginners or those with limited technical expertise.
Robust BI and data warehousing capabilities: Power BI has the ability to prepare and support business intelligence capabilities.
Power BI Disadvantages
Only available for Windows: Power BI is not natively available for macOS, which is a limitation for some users.
Performance with large datasets: It may face performance problems with very large datasets.
Less flexibility with advanced analytics: Not as strong as Tableau in dealing with complex analytical tasks.
Comparison Matrix: Tableau vs. Power BI
1. Data Handling and Performance
Tableau
It is known for its ability to handle large volumes of data with exceptional performance. This makes Tableau Ideal for organizations dealing with vast datasets.
Power BI
Power BI is capable of handling data more effectively. It is designed to work with a comparatively smaller amount of data than Tableau.
2. Data Visualization Capabilities
Tableau
It excels in a variety of data visualizations. It allows users to create highly customized, detailed and interactive data visualizations for reporting and analysis.
Power BI
Its customer support is limited to free users, but for paid users, it is fast and efficient.
3. Target Audience
Tableau
Tableau is best suited for experienced IT professionals like data analysts and those with advanced technical knowledge. A strong understanding of data science principles is needed to make the most out of it.
Power BI
It is designed for both beginners and experienced professionals. Its user-friendly interface makes it accessible to all users.
4. Calculations and Measurement Methods
Tableau
It uses MDX (Multidimensional Expressions) to measure dimensions. It can be very useful for complex datasets.
Power BI
It uses DAX (Data Analysis Expressions) to measure and calculate columns. DAX is a formula language that allows users to perform powerful calculations and create complex aggregations of their data.
5. Pricing and Affordability
Tableau
It is known for its high cost, despite offering a variety of features. Price can be a barrier for small businesses and organizations with limited budgets.
Power BI
Power BI is more affordable and has a range of pricing options that are more accessible to small businesses. It’s an attractive option for businesses that need tools without a hefty price tag.
Tableau vs. Power BI – Which is Better to Choose?
When deciding which tool is better, it all boils down to ascertaining who will use it. Tableau has been designed specifically to facilitate data analysis. On the other hand, Power BI is designed to serve the common stakeholder, not necessarily an expert data analyst or scientist.
Both tools are very robust. Tableau can be challenging to learn and use due to its somewhat user-unfriendly interface. Experienced users and data analysts, however, have no issue using it. It’s only slightly problematic for users who are new to the field of data analytics.
Power BI tools have an interactive interface that uses the drag-and-drop feature to help your team create data visualizations. You don’t need a degree in data analytics to be able to use it. But that does not mean it is better or worse than Tableau.
Conclusion
The key takeaway for you is that both tools are excellent, but serve different kinds of users and stakeholders. If you’re a small company without a strong IT team, go for Power BI. It’ll be easier for your resources to use. However, go for Tableau if you’re a medium or large company with a good IT team and enough budget.
We hope this article will help you make an informed decision about which business intelligence tool to go for. Tableau vs. Power BI?
If you need any further information or assistance regarding either of these platforms, feel free to contact us at [email protected].